Data journalism: Making it real
The following is an edited version of a chapter I contributed to a new book Data Journalism: Mapping the Future, published by Abramis academic publishing. The fact that I’m in it aside, I can heartily recommend it as a great mix of practical and contextual information. Go and buy one. Go on!
During the 2008 summer Olympics, the Beijing Air Track project took a team of photographers from Associated Press and used them to smuggle hand-held pollution sensors in to Beijing. Using their press access to the Olympic venues, they gathered pollution readings to test the Chinese government’s data that a series of extreme emergency measures put in place in the run-up to the games had improved the cities notoriously poor air quality. They were not the only organisation to use sensors in this way. The BBC’s Beijing office also used a hand-held sensor to test air pollution gathering data that appeared in a number of reports during the games.

Clean air. Clean data
The Air Track project and AP’s interactive report are now cited as a:
“prime example of how sensors, data journalism, and old-fashioned, on-the-ground reporting can be combined to shine a new level of accountability on official reports”.
In contrast to the Chinese data, the level of transparency displayed in the way the data was collected vividly illustrates how sensors can play a part in reinforcing data journalism role in the process of accountability.
Testing the context, provenance and ownership – where our data comes from and why – is a fundamental part of the data journalism process. If we are not critical of the data we use (and those that provide it), perhaps becoming over-reliant on data press releases , we can risk undermining our credibility with data-churnalism or, worse still, data-porn! . As data journalism practice evolves, whilst the basic critical skills will remain fundamental, it would seem logical to explore ways that we reduce our dependency on other sources all together. The Beijing project, with its use of sensors, offers a compelling solution. As Javaun Moradi, product manager for NPR digital, succinctly put it:
“If stage 1 of data journalism was ‘find and scrape data.’, then stage 2 was ‘ask government agencies to release data’ in easy to use formats. Stage 3 is going to be ‘make your own data’”
Crowdsensing data
The three stages that Moradi identifies are not mutually exclusive. Many data journalism projects already include an element of gathering new data often done using traditional forms of crowdsourcing; questionnaires or polls. As much as involving the audience has its benefits, it is notoriously unpredictable and time-consuming. But as individuals we already make a huge amount of data. That isn’t just data about us collected by others through a swipe of a loyalty card or by submitting a tax return online. It’s also data we collect about ourselves and the world around us.
An increasing number of us strap sensors to ourselves that track our health and exercise and the “internet of things” is creating a growing source of data from the buildings and objects around us. The sensors used by the AP team were specialist air pollution sensors that cost in excess of $400 – an expensive way for cash-strapped newsrooms to counter dodgy data. Since 2008 however, the price has dropped and the growing availability of cheap computing devices such as Raspberry Pi and Arduino and the collaborative and open source ethic of the hacker and maker communities, have lowered the barriers to entry. Now sensors, and the crowd they attract, are a serious option for developing data driven reporting.
Hunting for (real) bugs with data**
In 2013, New York braced itself for an invasion. Every 17 years a giant swarm of cicadas descend on the East Coast. The problem is that exactly when in the year the insects will appear is less predictable. The best indicator of the emergence of the mega-swarm (as many as a billion cicadas in a square mile) seems to be when the temperature eight inches below the ground reaches 64 degrees (18C). So when John Keefe, WNYC’s senior editor for data news and journalism technology, met with news teams to look at ways to cover the story, he thought of the tinkering he had done with Arduino’s and Raspberry Pi’s . He thought of sensors.
Keefe could not find a source for the data that offered any level of local detail across the whole of New York. He took the problem of how to collect the data to a local hackathon, organised by the stations popular science show Radiolab, who helped create a “recipe” for an affordable, easy to make temperature sensor which listeners could build and send results back to a website where they would map the information
Developing collaboration.
Whilst sensors play an enabling role in both examples, underpinning both the Beijing AirTrack and Cicada projects is the idea of collaboration. The Beijing project was originally developed by a team from the Spatial Information Lab at Columbia University. Combining the access of the media with the academic process and expertise of the lab gave the project a much bigger reach and authority. It’s a form of institutional collaboration that echoes in a small way in more recent projects such as The Guardian’s 2012’s Reading the riots. The Cicada project, on the other hand, offers an insight into a kind of community-driven collaboration that reflects the broader trend of online networks and the dynamic way groups form.
Safecast and the Fukushima nuclear crisis
On 9 March 2011, Joichi Ito was in Cambridge Massachusetts. He had travelled from Japan for an interview to become head of MIT’s prestigious Media Lab. The same day a massive underwater earthquake off the coast of Japan caused a devastating tsunami and triggered a meltdown at the Fukushima Dai-ichi nuclear plant, starting the worst nuclear crisis since Chernobyl in 1986. Ito, like many others, turned to the web and social media to find out if family and friends were safe and gather as much information as he could about the risk from radiation
At the same time as Ito was searching for news about his family, US web developer Marcelino Alvarez was in Portland scouring the web for information about the possible impact of the radiation on the US’s west coast. He decided to channel his “paranoia” and within 72 hours his company had created RDTN.org, a website aggregating and mapping information about the level of radiation .
For Alvarez and Ito the hunt for information soon developed into an effort to source geiger counters to send to Japan. Within a week of the disaster, the two had been introduced and RDTN.org became part of project that would become Safecast.org. As demand outstripped supply, their efforts to buy geiger counters quickly transformed into a community driven effort to design and build cheap, accurate sensors that could deployed quickly to gather up to date information.
SIDENOTE: It will be interesting to see how the experiences of Beijing and Safecast could come together in the coverage of the 2020 Olympics in Japan
Solving problems: Useful data and Purposed conversations
Examples such as WNYC’s cicada project show how a strong base of community engagement can help enable data-driven projects. But the Safecast network was not planned, it grew
“from purposed conversations among friends to full time organization gradually over a period of time”
There was no news conference to decide the when and the how it would respond or attempt to target contributors. It was a complex, self-selecting, mix of different motivations and passions that coalesced into a coherent response to solve a problem. It’s a level of responsiveness and scale of coverage that news organisations would struggle to match on their own. In that context, Moradi believes that journalism has a different role to play:
Whether they know it or not, they do need an objective third party to validate their work and give it authenticity. News organisations are uniquely positioned to serve as ethical overseers, moderators between antagonistic parties, or facilitators of open public dialogue
Building bridges
Taking a position as a “bridge” between those with data and resources and “the public who desperately want to understand the data and access it but need help” is a new reading of what many would recognise as a traditional part of journalism’s process and identity. The alignment of data journalism with the core principles of accountability and the purpose of investigative journalism, in particular, makes for a near perfect meeting point for the dynamic mix of like-minded hacks, academics and hackers, motivated not just by transparency and accountability. It also taps into a desire not just to highlight issues but begin to put in place solutions to problems. This mix of ideologies, as the WikiLeaks story shows , can be explosive but the output has proved invaluable in helping (re)establish the role of journalism in the digital space. Whether it is a catalyst to bring groups together, engage and amplify the work of others or a way, as Moradi puts it, to* “advance the cause of journalism by means other than reporting”* , sensor journalism seems to be an effective gateway to exploring these new opportunities
The digital divide
The rapid growth of data journalism has played a part in directing attention, and large sums of money, to projects that take abstract concepts like open government and “make them tangible, relevant and useful to real live humans in our communities”. It’s no surprise, then, that many of them take advantage of sensors and their associated communities to help build their resources. Innovative uses of smart phones, co-opting the internet of things or using crowd funded sensor project like the Air quality egg. But a majority of the successful data projects funded by organisations such as the Knight Foundation, have outputs that are almost exclusively digital; apps or data dashboards. As much as they rely on the physical to gather data, the results remain resolutely trapped in the digital space.
As far back as 2009, the UK government’s Digital Britain report warned:
“We are at a tipping point in relation to the on-line world. It is moving from conferring advantage on those who are in it to conferring active disadvantage on those who are without”
The solution to this digital divide is to focus on getting those who are not online connected. As positive as this is, it’s a predictably technological deterministic solution to the problem that critics say conflates digital inclusion with social inclusion . For journalism, and data journalism in particular, it raises an interesting challenge to claims of “combating information asymmetry” and increasing the data literacy of their readers on a mass scale .
Insight journalism: Journalism as data
In the same year as Digital Britain report appeared, the Bespoke project dived into the digital divide by exploring ways to create real objects that could act as interfaces to the online world. The project took residents from the Callon and Fishwick areas in Preston, Lancashire, recognised as some of the most deprived areas in the UK, and trained them as community journalists who contributed to a “hyperlocal” newspaper that was distributed round the estate. The paper also served as a way of collecting “data” for designers who developed digitally connected objects aimed at solving problems identified by the journalists. A process the team dubbed insight journalism .
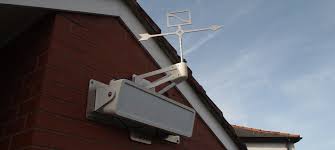
One example, the Wayfinder, was a digital display and a moving arrow which users could text to point to events happening in the local area.
[ ]
]
Bespoke’s Viewpoint Contour Homes’ office in Callon, Preston (c) Garry Cook
Another, Viewpoint was a kiosk, placed in local shops that allowed users to vote on questions from other residents, the council and other interested parties. The questioner had to agree that they would act on the responses they got, a promise that was scrutinised by the journalists.
The idea was developed during the 2012 Unbox festival in India, when a group of designers and journalists applied the model of insight journalism to the issue of sexual harassment on the streets of New Delhi. The solution, built on reports and information gathered by journalists, was to build a device that would sit on top of one of the many telegraph poles that clutter the streets attracting thousands of birds. The designers created a bird table fitted with a bell. When a woman felt threatened or was subjected to unwanted attention she could use Twitter to “tweet” the nearest bird table and a bell would ring. The ringing bell would scatter any roosting birds giving a visible sign of a problem in the area. The solution was as poetic as it was practical, highlighting not just the impact of the physical but the power of journalism as data to help solve a problem.
Stage four: Make data real
Despite its successes sensor journalism is still a developing area and it is not yet clear if it will see any growth beyond the environmental issues that drive many of the examples presented here. Like data journalism, much of the discussion around the field focuses on the new opportunities it presents. These often intersect with equally nascent but seductive ideas such as drone journalism. More often than not, though, they bring the discussion back to the more familiar ground of the challenges of social media, managing communities and engagement.
As journalism follows the mechanisms of the institutions it is meant to hold to account into the digital space, it is perhaps a chance to think about how data journalism can move beyond simply building capacity within the industry, providing useful case studies. Perhaps it is a way to help journalism re-connect to the minority of those in society who, by choice or by circumstance, are left disconnected.
Thinking about ways to make the data we find and the data journalism we create physical, closes a loop on a process that starts with real people in the real world. It begins to raise important questions about what journalism’s role should be in not just capturing the problems and raising awareness but also creating solutions. In an industry struggling to re-connect, it maybe also starts to address the issue of solving the problem placing journalism back in the community and making it sustainable. Researchers reflecting on the Bespoke project noted that:
“elements of the journalism process put in place to inform the design process have continued to operate in the community and have proven to be more sustainable as an intervention than the designs themselves”
If stage three is to make our own data, perhaps it is time to start thinking about stage four of data journalism and make data real.
* Refs:*
Alba, Davey (2013) Sensors: John Keefe and Matt Waite on the current possibilities, Tow Centre for Digital Journalism, 5 June. Available online at http://towcenter.org/blog/sensors-john-keefe-and-matt-waite-on-the-current-possibilities/, accessed on 12 August 2013
Alvarez, Marcelino (2011) 72 Hours from concept to launch: RDTN.org, Uncorked Words, 21 March. Available online at http://uncorkedstudios.com/2011/03/21/72-hours-from-concept-to-launch-rdtn-org/, accessed on 12 August 2013
Ashton, Kevin (2009) That “Internet of Things” thing, RFiD Journal 22 pp 97-114. Available online at http://www.rfidjournal.com/articles/view?4986, accessed on 25 September, 2013
Department of Business Innovation and Skills (2009) Digital Britain: Final Report, Stationery Office
BBC (2008) In pictures: Beijing pollution-watch, BBC News website, 24 August. Available online at http://news.bbc.co.uk/sport1/hi/front_page/6934955.stm, accessed on 12 August 2013
Blum-Ross, Alicia, Mills, John, Egglestone, Paul and Frohlich, David (2013) Community media and design: Insight journalism as a method for innovation, Journal of Media Practice, Vol. 14, No 3, 1 September pp 171-192
Bradshaw, Paul. and Brightwell, Andy. (2012) Crowdsourcing investigative journalism: Help me Investigate: A case study, Siapera, Eugenia and Veglis, Andreas (eds) The Handbook of Global Online Journalism, London: John Wiley & Sons pp 253-271
Ellison, Sarah (2011) The man who spilled the secrets, Vanity Fair, February. Available online at http://www.vanityfair.com/politics/features/2011/02/the-guardian-201102 , accessed on 13 September 2013
Gray, Jonathan, Chambers, Lucy and Bounegru, Liliana (2012) The Data Journalism Handbook. O’Reilly. Free version available online at http://datajournalismhandbook.org/
Howard, Alex (2013) Sensoring the news, O’Reilly Radar, 22 March. Available at http://radar.oreilly.com/2013/03/sensor-journalism-data-journalism.html, accessed on 12 August 2013
Kalin, Sari (2012) Connection central. MIT news magazine, 21 August. Available at http://www.technologyreview.com/article/428739/connection-central/, accessed on 22nd August 2013
Knight, Megan (2013) Data journalism: A preliminary analysis of form and content. A paper delivered to the International Association for Media and Communication Research, 25-29 June, Dublin
Livingstone, Sonia and Lunt, Peter (2013) Ofcom’s plans to promote “participation”, but whose and in what? LSE Media Policy Project, 27 February. Available online at http://blogs.lse.ac.uk/mediapolicyproject/2013/02/27/ofcoms-plans-to-promote-participation-but-whose-and-in-what/, accessed on 23 September 2013
Moradi, Javaun (2011) What do open sensor networks mean for journalism?, Javaun’s Ramblings, 16 December 16. Available online at http://javaunmoradi.com/blog/2011/12/16/what-do-open-sensor-networks-mean-for-journalism/#sthash.yXXlHoa2.dpuf, accessed on 9 August 2013
Oliver, Laura (2010) UK government’s open data plans will benefit local and national journalists, Journalism.co.uk, 1 June. Available online at http://www.journalism.co.uk/news/uk-government-039-s-open-data-plans-will-benefit-local-and-national-journalists/s2/a538929/, accessed on 12 August 2013
Rogers, Simon. (2011) Facts are Sacred: The Power of Data (Guardian shorts), Cambridge, UK: Guardian Books
Safecast History (no date) Safecast.com. Available online at http://blog.safecast.org/history/, accessed on 25 September 2013
Sopher, Christopher (2013) How can we harness data and information for the health of communities?, Knight Foundation, 16 August. Available online at https://www.newschallenge.org/challenge/healthdata/brief.html accessed on 10 September 2013.
Taylor, Nick, Marshall, Justin, Blum-Ross, Alicia., Mills, John, Rogers, Jon, Egglestone, Paul, Frohlich, David M., Wright, Peter, Olivier, Patrick (2012) Viewpoint: Empowering Communities with Situated Voting Devices, Proc. CHI 2012 pp 1361-1370, New York: ACM (don’t understand this reference)
Taylor, Nick, Wright, Peter, Olivier, Patrick and Cheverst, Kieth (2013) Leaving the wild: lessons from community technology handovers. in CHI ’13 (don’t understand this reference)
Waite, Matt. (2013) How sensor journalism can help us create data, improve our storytelling, Poynter.org. 17 April. Available online at http://www.poynter.org/how-tos/digital-strategies/210558/how-sensor-journalism-can-help-us-create-data-improve-our-storytelling/, accessed on 28 August 2013